
Periods when Bitcoin investors lose confidence have often laid the groundwork for the market’s strongest recoveries, and recent on-chain data suggests sentiment may once again be approaching those historically significant levels.
According to analysis from K33 Research, more than half of Bitcoin’s circulating supply briefly fell below investors’ acquisition prices in early June, reflecting one of the highest levels of unrealized losses seen during the current market cycle. While such conditions typically fuel bearish sentiment, history shows they have also appeared shortly before major market reversals.
The threshold was crossed on June 5, and Bitcoin has now spent several weeks in territory that has historically preceded long-term trend changes. Looking back at previous cycles, similar periods lasted 101 days in 2014, 23 days in 2018, and only 13 days in 2022 before Bitcoin established a macro bottom and began recovering.
Rather than viewing widespread losses as a bearish signal on their own, K33 argues they often indicate that speculative excess has already been flushed from the market. Once weaker holders exit, selling pressure gradually subsides, allowing long-term investors to absorb supply.
CryptoQuant has identified a similar pattern using a different on-chain indicator.
Its Realized Cap Variance (RCV) model, which compares Bitcoin’s realized capitalization with its market valuation, has dropped into the lowest 6% of historical readings. Such levels suggest that investors’ cost basis has become heavily compressed relative to the current market price, a condition rarely observed outside the late stages of prolonged downturns.
CryptoQuant analyst Crazzyblockk noted that the model’s standardized Z-score has fallen to -2.35, indicating that much of the optimism priced into previous rallies has disappeared. Historically, readings below -2.0 have coincided with periods when long-term accumulation quietly replaced speculative trading.
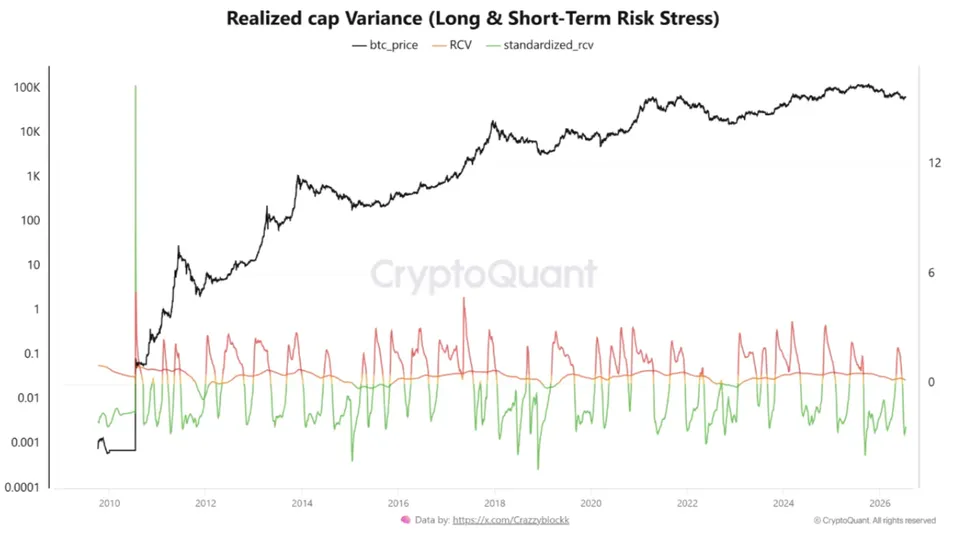
The same indicator produced comparable signals ahead of Bitcoin’s recoveries in 2015, 2018, and 2022. Its most extreme reading, -4.68, occurred in November 2018, almost exactly when Bitcoin bottomed near $3,792 before beginning a new multi-year uptrend.
Although macroeconomic uncertainty and market volatility continue to weigh on digital assets, the latest on-chain data paints a picture of a market that is becoming increasingly driven by patient capital rather than speculative momentum.
For long-term investors, the current environment may represent less a continuation of fear than a transition phase, where confidence remains scarce but historical data suggests the foundations for the next cycle are gradually taking shape.